I have a bit of a love / hate relationship with the Windows Performance Toolkit. It’s easy to be overwhelmed by it, and it can be a bear to use sometimes, but there’s very few tools as powerful when it comes to understanding performance, and it’s hands down the best tool on Windows for doing apples-to-apples comparisons of browser performance.
What is WPA?#
The part of the Windows Performance Toolkit that we’re instersted in is the Windows Performance Recorder (WPR) and the Windows Performance Analyzer (WPA). There’s extensive information on using both like this, this, this, and this, so rather than write a below average tutorial, I’ll defer to those fine resources. Just know that Event Tracing for Windows (ETW), the underlying technology, provides a low overhead, full system view of performance.
What are performance marks and measures?#
performance.mark() and performance.measure() are both part of the User Timing spec. It’s
well supported, with only mobile Safari and Opera Mini lacking support, and excellent polyfills like Nolan Lawson’s
excellent Marky are available.
These APIs allow a web developer to add “points of interest”, such as when a component renders, or when background events start and stop, to the UI responsiveness tool in your browser’s developer tools. You can also collect your users’ marks using your site analytics to better understand how your components behave in the real-world, but we’ll save that for another post.
Viewing Edge’s marks in WPA#
Capturing marks from Edge couldn’t be simpler, just:
- Ensure you record your trace using the Edge Browser scenario
- Run your scenario which uses the
performance.mark()API - Save your trace
That’s really it!
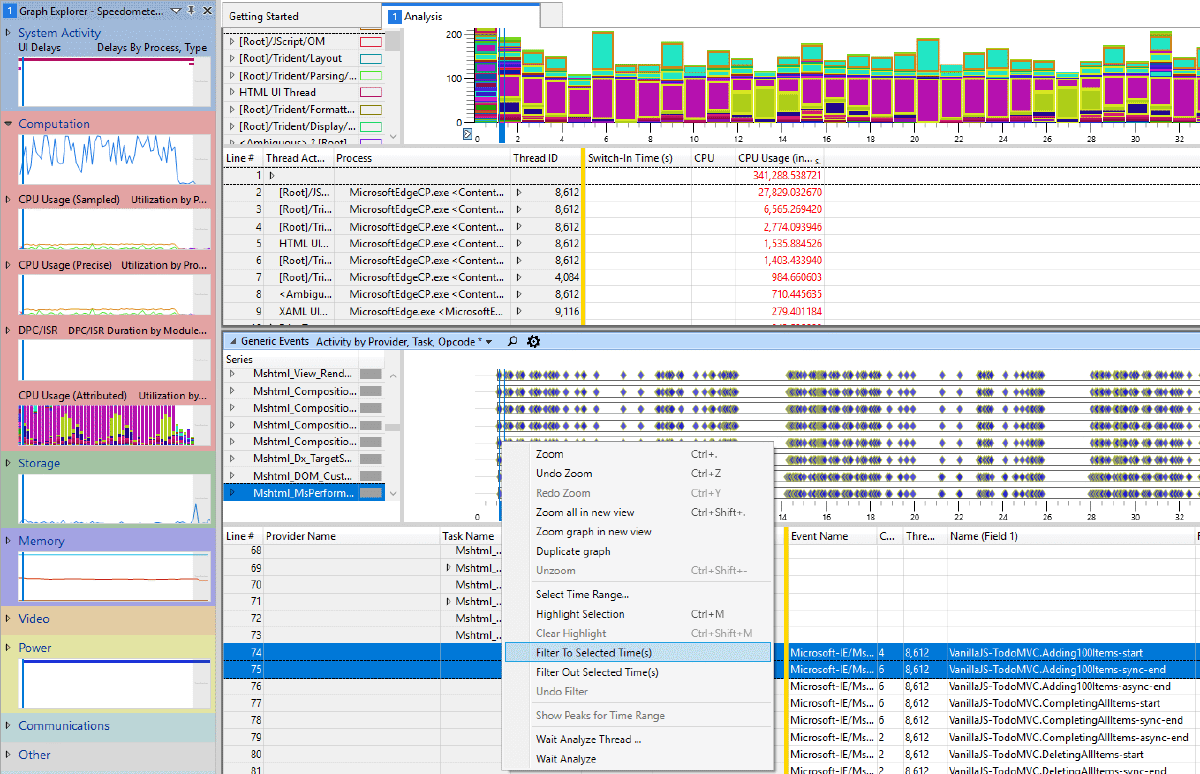
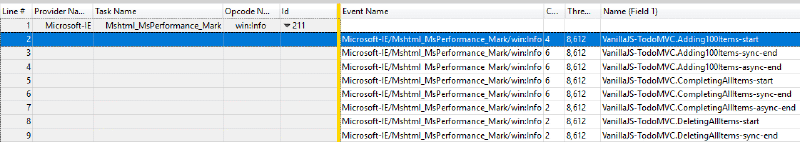
To view the marks, load up the trace and add the Generic Events graph, which is under the System Activity section. Each mark will be an event under the Microsoft-IE provider, and the Mshtml_MsPerformance_Mark Task Name. The name your app supplied for the event is available in Name field, which is also Field 1 (ETW providers can label the event’s payload fields).
Viewing Chrome’s marks in WPA#
There’s a bit more effort involved in getting Chrome to emit ETW events, but thanks to Bruce Dawson (who’s blog you should definitely be reading!) and the UIforETW project, we have all the information we need.
Registering Chrome’s ETW provider#
First we need to register Chrome’s ETW provider. Registration tells the ETW system how to “subscribe” to Chrome’s events and how to decode the binary payload into fields. To register:
- Download
DummyChrome.dllandchrome_events_win.manfrom https://github.com/google/UIforETW/blob/master/bin/ - Unregister and reregister (so that any changes take effect) Chrome’s ETW event provider and manifests using
wevtutilfrom an elevated command prompt
wevtutil uninstall-manifest C:\full\path\to\chrome_events_win.man
wevtutil install-manifest C:\full\path\to\chrome_events_win.man /resourceFilePath:C:\full\path\to\DummyChrome.dll /messageFilePath:C:\full\path\to\DummyChrome.dll
NOTE: Replace
C:\full\path\to\as necessary.wevtutilrequires an absolute path.
NOTE:
wevtutilmay give a warning similar to**** Warning: Publisher Chrome resources could not be found or are not accessible. This warning is safe to ignore.
- Finally, in order for Chrome to actually emit events, we need to tell Chrome to enable ETW tracing. That’s as simple
as passing flag
--trace-export-events-to-etwwhen starting Chrome
call "C:\Program Files (x86)\Google\Chrome\Application\chrome.exe" --trace-export-events-to-etwNOTE: You may need to close existing instances of Chrome before passing this flag to ensure you get the correct behavior. NOTE: Make sure to start Chrome from a regular Command line instance and not from an Administrator Command Line. The higher priveleges used in the admin command line can at times mess with the execution of Chrome.
Using a Chrome WPR Recording Profile#
Now that Chrome is all set up to emit ETW events, we need to set up WPR to subscribe to those events. The easiest way to do that is:
- Save this XML file as a .wprp (Windows Performance Recorder Profile) file.
<?xml version="1.0" encoding="utf-8"?>
<WindowsPerformanceRecorder Version="1.0" Author="Matt Kotsenas" Copyright="Microsoft Corporation" Company="Microsoft Corporation">
  <Profiles>
    <EventCollector Id="EventCollector_ChromeTraceSession" Name="ChromeTraceSession">
      <BufferSize Value="1024" />
      <Buffers Value="400" />
    </EventCollector>
    <EventProvider Id="EventProvider_Chrome" Name="D2D578D9-2936-45B6-A09f-30E32715F42D">
      <Keywords>
        <!-- 0xA0000000000000A0 exports all Chrome tracing events that are enabled by default. See https://codereview.chromium.org/1176243016 for more info -->
        <Keyword Value="0xA0000000000000A0" />
      </Keywords>
    </EventProvider>
    <Profile Id="ChromeTracing.Verbose.File" Name="ChromeTracing" Description="Chrome tracing" LoggingMode="File" DetailLevel="Verbose">
      <ProblemCategories>
        <ProblemCategory Value="Custom"/>
      </ProblemCategories>
      <Collectors>
        <EventCollectorId Value="EventCollector_ChromeTraceSession">
          <EventProviders>
            <EventProviderId Value="EventProvider_Chrome" />
          </EventProviders>
        </EventCollectorId>
      </Collectors>
    </Profile>
    <Profile Id="ChromeTracing.Verbose.Memory" Name="ChromeTracing" Description="Chrome tracing" LoggingMode="Memory" DetailLevel="Verbose">
      <ProblemCategories>
        <ProblemCategory Value="Custom"/>
      </ProblemCategories>
      <Collectors>
        <EventCollectorId Value="EventCollector_ChromeTraceSession">
          <EventProviders>
            <EventProviderId Value="EventProvider_Chrome" />
          </EventProviders>
        </EventCollectorId>
      </Collectors>
    </Profile>
  </Profiles>
</WindowsPerformanceRecorder>- Add the profile to WPR by clicking “Add profiles…” and selecting the file
- Start the trace!
Viewing the marks#
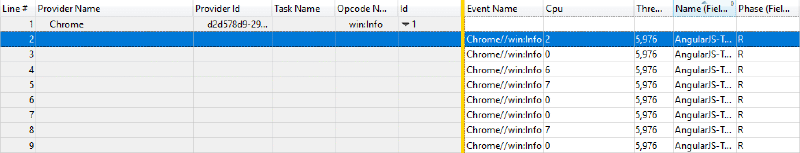
Just like with Edge, Chrome emits an event for each mark, which can be found in the Generic Events table. Unlike Edge, Chrome uses only a single provider, (Chrome) and event type (a generic “info” event). You can find your app’s marks by searching in the Name field (also Field 1).
Filtering to marks#
Also a quick tip, you can easily filter all your ETW graphs to just include the time between two marks by selcting the marks, then in a graph right-clicking in the highlighted range and selecting “Filter to Selected Time(s)”. This feature is really useful to focus in on a specific part of your app.

And that’s that! You can now pinpoint your web app’s scenario in both Edge and Chrome, and use the full power of WPA to drill into the nitty gritty details. Stay tuned for future articles, where I’ll discuss how to automate finding marks in ETLs, and how to export ETW data matching a measure to support performance monitoring / continous integration scenarios.